|
The Division of Water Resources (DWR) provides the data contained within this
Local Water Supply Plan (LWSP) as a courtesy and service to our customers.
DWR staff does not field verify data. Neither DWR, nor any other party
involved in the preparation of this LWSP attests that the data is completely
free of errors and omissions. Furthermore, data users are cautioned that
LWSPs labeled PROVISIONAL have yet to be reviewed by DWR staff. Subsequent
review may result in significant revision. Questions regarding the accuracy
or limitations of usage of this data should be directed to the water system
and/or DWR.
1. System Information
Contact Information
Provisional
| Water System Name: |
Fremont |
|
PWSID: |
04-96-025 |
| Mailing Address: | P.O. Box 4
Fremont, NC 27830 | Ownership: | Municipality |
| |
| Contact Person: | Josh Pulley | Title: | Water System ORC |
| Phone: | 919-222-4875 | Cell/Mobile: | -- |
| |
| Secondary Contact: | Mike Houston | | Phone: | 919-812-6088 |
| Mailing Address: |
, NC | Cell/Mobile: | -- |
Distribution System
| Line Type |
Size Range (Inches) |
Estimated % of lines |
| Asbestos Cement |
6 |
0.10 % |
| Cast Iron |
2-10 |
36.49 % |
| Galvanized Iron |
1-2 |
0.10 % |
| Polyvinyl Chloride |
2-12 |
63.31 % |
Programs
Water Conservation
2. Water Use Information
Service Area
| Sub-Basin(s) | % of Service Population |
|---|
| Contentnea Creek (10-2) | 100 % |
|
| County(s) | % of Service Population |
|---|
| Wayne | 100 % |
|
Water Use by Type
| Type of Use |
Metered
Connections |
Metered
Average Use (MGD) |
Non-Metered
Connections |
Non-Metered
Estimated Use (MGD) |
| Residential |
754 |
0.0576 |
0 |
0.0000 |
| Commercial |
99 |
0.0201 |
0 |
0.0000 |
| Industrial |
0 |
0.0000 |
0 |
0.0000 |
| Institutional |
0 |
0.0000 |
0 |
0.0000 |
How much water was used for system processes (backwash, line cleaning, flushing, etc.)? 0.0005 MGD
Regarding the high amount of unaccounted-for-water (30% of supply) -- we experienced multiple leaks within our system that accounted for the increase in our overall UAW%. These leaks have been repaired. Water Sales
| Purchaser |
PWSID |
Average
Daily Sold
(MGD) |
Days
Used |
Contract |
Required to
comply with water
use restrictions? |
Pipe Size(s)
(Inches) |
Use
Type |
| MGD |
Expiration |
Recurring |
| Town of Pikeville |
04-96-030 |
0.0418 |
62 |
0.1000 |
2050 |
Yes |
Yes |
2 |
Emergency |
3. Water Supply Sources
Monthly Withdrawals & Purchases
|
Average Daily
Use (MGD) |
Max Day
Use (MGD) |
|
Average Daily
Use (MGD) |
Max Day
Use (MGD) |
|
Average Daily
Use (MGD) |
Max Day
Use (MGD) |
| Jan |
0.1205 |
|
May |
0.1257 |
|
Sep |
0.1731 |
|
| Feb |
0.0925 |
|
Jun |
0.1180 |
|
Oct |
0.1326 |
|
| Mar |
0.1197 |
|
Jul |
0.1762 |
|
Nov |
0.1455 |
|
| Apr |
0.1541 |
|
Aug |
0.1590 |
|
Dec |
0.1431 |
|

Water Purchases From Other Systems
| Seller |
PWSID |
Average
Daily Purchased
(MGD) |
Days
Used |
Contract |
Required to
comply with water
use restrictions? |
Pipe Size(s)
(Inches) |
Use
Type |
| MGD |
Expiration |
Recurring |
| Wayne Water District |
04-96-065 |
0.1218 |
365 |
0.3000 |
2035 |
Yes |
Yes |
8&12 |
Regular |
The contract with WWD does not limit the volume of water, and does not have an expiration date. The town purchases water on a day to day basis. Also, WWD has new wells around the area to help supply us if we ever need additional water. Accordingly, and given projected demands, a contract amount of 0.3000 MGD is shown here to keep projected 2030 to 2050 demand-to-supply ratios calculated in this 2025 LWSP below 80%. 4. Wastewater Information
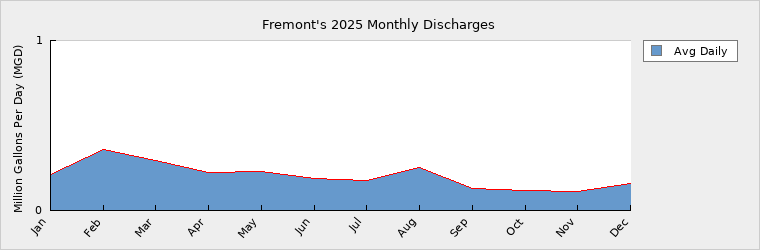
Monthly Discharges
|
Average Daily
Discharge (MGD) |
|
Average Daily
Discharge (MGD) |
|
Average Daily
Discharge (MGD) |
| Jan |
0.2139 |
May |
0.2295 |
Sep |
0.1306 |
| Feb |
0.3584 |
Jun |
0.1853 |
Oct |
0.1190 |
| Mar |
0.2914 |
Jul |
0.1775 |
Nov |
0.1108 |
| Apr |
0.2219 |
Aug |
0.2528 |
Dec |
0.1606 |
Wastewater Permits
| Permit Number |
Type |
Permitted Capacity
(MGD) |
Design Capacity
(MGD) |
Average Annual
Daily Discharge
(MGD) |
Maximum Day Discharge
(MGD) |
Receiving Stream |
Receiving Basin |
| WQ0034102 |
WWTP |
0.0920 |
0.3600 |
0.0260 |
|
Aycock Swamp |
Contentnea Creek (10-2) |
| WQCS00298 |
CS |
0.3500 |
0.3500 |
0.0000 |
|
Neuse River |
Contentnea Creek (10-2) |
WQ0034102 is the spray field, which averaged 0.0260 MGD.
WQCS00298 is the discharge to the City of Goldsboro, which averaged 0.1775 MGD. Wastewater Interconnections
| Water System |
PWSID |
Type |
Average Daily Amount |
Contract
Maximum (MGD) |
| MGD |
Days Used |
| City of Goldsboro |
04-96-010 |
Discharging |
0.1775 |
365 |
1.0000 |
5. Planning
Projections
| |
2025 |
2030 |
2040 |
2050 |
2060 |
2070 |
| Year-Round Population |
1,265 |
1,284 |
1,317 |
1,346 |
1,377 |
1,408 |
| Seasonal Population |
0 |
0 |
0 |
0 |
0 |
0 |
| |
| Residential |
0.0576 |
0.0584 |
0.0598 |
0.0611 |
0.0624 |
0.0638 |
| Commercial |
0.0201 |
0.0204 |
0.0209 |
0.0213 |
0.0218 |
0.0223 |
| Industrial |
0.0000 |
0.0000 |
0.0000 |
0.0000 |
0.0000 |
0.0000 |
| Institutional |
0.0000 |
0.0000 |
0.0000 |
0.0000 |
0.0000 |
0.0000 |
| System Process |
0.0005 |
0.0005 |
0.0005 |
0.0005 |
0.0005 |
0.0005 |
| Unaccounted-for |
0.0365 |
0.0370 |
0.0379 |
0.0387 |
0.0395 |
0.0404 |
Demand v/s Percent of Supply
| |
2025 |
2030 |
2040 |
2050 |
2060 |
2070 |
| Surface Water Supply |
0.0000 |
0.0000 |
0.0000 |
0.0000 |
0.0000 |
0.0000 |
| Ground Water Supply |
0.0000 |
0.0000 |
0.0000 |
0.0000 |
0.0000 |
0.0000 |
| Purchases |
0.3000 |
0.3000 |
0.3000 |
0.3000 |
0.3000 |
0.3000 |
| Future Supplies |
0.0000 |
0.0000 |
0.0000 |
0.0000 |
0.0000 |
| Total Available Supply (MGD) |
0.3000 |
0.3000 |
0.3000 |
0.3000 |
0.3000 |
0.3000 |
| Service Area Demand |
0.1147 |
0.1163 |
0.1191 |
0.1216 |
0.1242 |
0.1270 |
| Sales |
0.0071 |
0.0418 |
0.0418 |
0.0418 |
0.0418 |
0.0418 |
| Future Sales |
0.0000 |
0.0000 |
0.0000 |
0.0000 |
0.0000 |
| Total Demand (MGD) |
0.1218 |
0.1581 |
0.1609 |
0.1634 |
0.1660 |
0.1688 |
| Demand as Percent of Supply |
41% |
53% |
54% |
54% |
55% |
56% |

The purpose of the above chart is to show a general indication of how the long-term per capita water demand changes over time. The per capita water demand may actually be different than indicated due to seasonal populations and the accuracy of data submitted. Water systems that have calculated long-term per capita water demand based on a methodology that produces different results may submit their information in the notes field.
Your long-term water demand is 46 gallons per capita per day. What demand management practices do you plan to implement to reduce the per capita water demand (i.e. conduct regular water audits, implement a plumbing retrofit program, employ practices such as rainwater harvesting or reclaimed water)? If these practices are covered elsewhere in your plan, indicate where the practices are discussed here.
The Fremont contracts do not limit the volume of water received from Wayne Water Districts. The Fremont contract does not have an expiration date, as additional water is available upon demand from the Town.
Are there other demand management practices you will implement to reduce your future supply needs? N/A
What supplies other than the ones listed in future supplies are being considered to meet your future supply needs? WWD has new wells around the area to help supply us if we ever need additional water.
How does the water system intend to implement the demand management and supply planning components above? Will be advised by engineer.
We are currently looking at the installation of new water meters to help offset billing / usage inaccuracies and actively looking for & repairing system leaks to reduce our overall system demand.
Additional Information
Has this system participated in regional water supply or water use planning? No
What major water supply reports or studies were used for planning? N/A
Please describe any other needs or issues regarding your water supply sources, any water system deficiencies or needed improvements (storage, treatment, etc.) or your ability to meet present and future water needs. Include both quantity and quality considerations, as well as financial, technical, managerial, permitting, and compliance issues: N/A
The Division of Water Resources (DWR) provides the data contained within this
Local Water Supply Plan (LWSP) as a courtesy and service to our customers.
DWR staff does not field verify data. Neither DWR, nor any other party
involved in the preparation of this LWSP attests that the data is completely
free of errors and omissions. Furthermore, data users are cautioned that
LWSPs labeled PROVISIONAL have yet to be reviewed by DWR staff. Subsequent
review may result in significant revision. Questions regarding the accuracy
or limitations of usage of this data should be directed to the water system
and/or DWR.
|