|
The Division of Water Resources (DWR) provides the data contained within this
Local Water Supply Plan (LWSP) as a courtesy and service to our customers.
DWR staff does not field verify data. Neither DWR, nor any other party
involved in the preparation of this LWSP attests that the data is completely
free of errors and omissions. Furthermore, data users are cautioned that
LWSPs labeled PROVISIONAL have yet to be reviewed by DWR staff. Subsequent
review may result in significant revision. Questions regarding the accuracy
or limitations of usage of this data should be directed to the water system
and/or DWR.
1. System Information
Contact Information
Complete
| Water System Name: |
Stumpy Point WSD |
|
PWSID: |
60-28-002 |
| Mailing Address: | P.O. Box 1000
Manteo, NC 27954 | Ownership: | County |
| |
| Contact Person: | Robert Wernock | Title: | Superintendent |
| Phone: | 252-475-5808 | Cell/Mobile: | -- |
| |
| Secondary Contact: | Jessica King | | Phone: | 252-475-5601 |
| Mailing Address: | 600 Mustian Street
Kill Devil Hills, NC 27948 | Cell/Mobile: | -- |
Distribution System
| Line Type |
Size Range (Inches) |
Estimated % of lines |
| Polyvinyl Chloride |
2-10 |
100.00 % |
Programs
Water Conservation
2. Water Use Information
Service Area
| Sub-Basin(s) | % of Service Population |
|---|
| Albemarle Sound (12-1) | 100 % |
|
| County(s) | % of Service Population |
|---|
| Dare | 100 % |
|
Water Use by Type
| Type of Use |
Metered
Connections |
Metered
Average Use (MGD) |
Non-Metered
Connections |
Non-Metered
Estimated Use (MGD) |
| Residential |
140 |
0.0157 |
0 |
0.0000 |
| Commercial |
3 |
0.0003 |
0 |
0.0000 |
| Industrial |
1 |
0.0010 |
0 |
0.0000 |
| Institutional |
0 |
0.0000 |
0 |
0.0000 |
How much water was used for system processes (backwash, line cleaning, flushing, etc.)? 0.0060 MGD
3. Water Supply Sources
Monthly Withdrawals & Purchases
|
Average Daily
Use (MGD) |
Max Day
Use (MGD) |
|
Average Daily
Use (MGD) |
Max Day
Use (MGD) |
|
Average Daily
Use (MGD) |
Max Day
Use (MGD) |
| Jan |
0.0278 |
0.1330 |
May |
0.0294 |
0.1066 |
Sep |
0.0283 |
0.0829 |
| Feb |
0.0264 |
0.0840 |
Jun |
0.0317 |
0.1002 |
Oct |
0.0277 |
0.0843 |
| Mar |
0.0246 |
0.1217 |
Jul |
0.0293 |
0.0994 |
Nov |
0.0230 |
0.0741 |
| Apr |
0.0323 |
0.1110 |
Aug |
0.0289 |
0.0982 |
Dec |
0.0316 |
0.1348 |
Wells are not used on a daily basis but are used intermittently to fill elevated tank. Pumping records are stored electronically and have been verified. The system only operates one well at a time. At certain times based on use, leaks, etc., we must process longer than 12 hours per day. We choose to operate on a selected well for the entire process run. Starting and stopping wells tend to stir up sediment in the well and cause fouling issues in the pre-treatment process and the start/stop process causing shifting in the membranes in the RO equipment which increases the possibility of an O-ring or brine seal failure. Being each well usually rests 2-3 days between use it is more favorable to extend the run on the well than risk equipment failure in the plant. 
Ground Water Sources
| Name or Number |
Average Daily Withdrawal (MGD) |
Max Day Withdrawal (MGD) |
12-Hour Supply
(MGD) |
CUA Reduction |
Year Offline |
Use Type |
| MGD |
Days Used |
| Stumpy 1 |
0.0880 |
53 |
|
0.0500 |
|
|
Regular |
| Stumpy 2 |
0.0880 |
53 |
0.156 |
0.0490 |
|
|
Regular |
Ground Water Sources (continued)
| Name or Number |
Well Depth (Feet) |
Casing Depth
(Feet) |
Screen Depth (Feet) |
Well Diameter (Inches) |
Pump Intake Depth (Feet) |
Metered? |
| Top |
Bottom |
| Stumpy 1 |
200 |
170 |
170 |
190 |
6 |
80 |
Yes |
| Stumpy 2 |
230 |
170 |
170 |
190 |
4 |
80 |
Yes |
Wells are not used on a daily basis but are used intermittently to fill elevated tank. Pumping records are stored electronically and have been verified. The system only operates one well at a time. At certain times based on use, leaks, etc., we must process longer than 12 hours per day. We choose to operate on a selected well for the entire process run. Starting and stopping wells tend to stir up sediment in the well and cause fouling issues in the pre-treatment process and the start/stop process causing shifting in the membranes in the RO equipment which increases the possibility of an O-ring or brine seal failure. Being each well usually rests 2-3 days between use it is more favorable to extend the run on the well than risk equipment failure in the plant. Water Treatment Plants
| Plant Name |
Permitted Capacity
(MGD) |
Is Raw Water Metered? |
Is Finished Water Ouput Metered? |
Source |
| Stumpy Point Water Plant |
0.0600 |
Yes |
Yes |
Ground Water Wells |
Wells are not used on a daily basis but are used intermittently to fill elevated tank. Pumping records are stored electronically and have been verified. The system only operates one well at a time. At certain times based on use, leaks, etc., we must process longer than 12 hours per day. We choose to operate on a selected well for the entire process run. Starting and stopping wells tend to stir up sediment in the well and cause fouling issues in the pre-treatment process and the start/stop process causing shifting in the membranes in the RO equipment which increases the possibility of an O-ring or brine seal failure. Being each well usually rests 2-3 days between use it is more favorable to extend the run on the well than risk equipment failure in the plant. 4. Wastewater Information
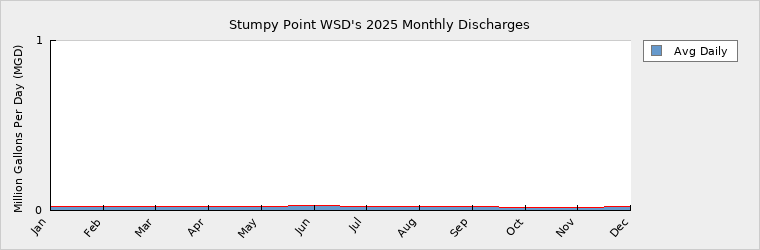
Monthly Discharges
|
Average Daily
Discharge (MGD) |
|
Average Daily
Discharge (MGD) |
|
Average Daily
Discharge (MGD) |
| Jan |
0.0219 |
May |
0.0250 |
Sep |
0.0230 |
| Feb |
0.0219 |
Jun |
0.0265 |
Oct |
0.0204 |
| Mar |
0.0212 |
Jul |
0.0232 |
Nov |
0.0202 |
| Apr |
0.0247 |
Aug |
0.0245 |
Dec |
0.0245 |
Wastewater Permits
| Permit Number |
Type |
Permitted Capacity
(MGD) |
Design Capacity
(MGD) |
Average Annual
Daily Discharge
(MGD) |
Maximum Day Discharge
(MGD) |
Receiving Stream |
Receiving Basin |
| NC0086932 |
WTP |
0.0430 |
0.0360 |
0.0000 |
0.0000 |
Stumpy Point Bay |
Albemarle Sound (12-1) |
| NC0088391 |
WWTP |
0.0500 |
0.0500 |
0.0230 |
|
Stumpy Point Bay |
Albemarle Sound (12-1) |
The Stumpy Point Wastewater Treatment plant was added to the area in 2008. No one was aware that it needed to be added to this report until recently. The system is owned and operated by Dare County Water. The facility is also managed (ORC) by the same personnel as the Stumpy Point Water Treatment Plant. 5. Planning
Projections
| |
2025 |
2030 |
2040 |
2050 |
2060 |
2070 |
| Year-Round Population |
269 |
270 |
275 |
285 |
290 |
300 |
| Seasonal Population |
0 |
0 |
0 |
0 |
0 |
0 |
| |
| Residential |
0.0157 |
0.0162 |
0.0163 |
0.0165 |
0.0175 |
0.0180 |
| Commercial |
0.0003 |
0.0076 |
0.0076 |
0.0080 |
0.0084 |
0.0088 |
| Industrial |
0.0010 |
0.0000 |
0.0000 |
0.0000 |
0.0000 |
0.0000 |
| Institutional |
0.0000 |
0.0000 |
0.0000 |
0.0000 |
0.0000 |
0.0000 |
| System Process |
0.0060 |
0.0060 |
0.0061 |
0.0062 |
0.0063 |
0.0064 |
| Unaccounted-for |
0.0026 |
0.0038 |
0.0039 |
0.0040 |
0.0042 |
0.0043 |
Demand v/s Percent of Supply
| |
2025 |
2030 |
2040 |
2050 |
2060 |
2070 |
| Surface Water Supply |
0.0000 |
0.0000 |
0.0000 |
0.0000 |
0.0000 |
0.0000 |
| Ground Water Supply |
0.0990 |
0.0990 |
0.0990 |
0.0990 |
0.0990 |
0.0990 |
| Purchases |
0.0000 |
0.0000 |
0.0000 |
0.0000 |
0.0000 |
0.0000 |
| Future Supplies |
0.0000 |
0.0000 |
0.0000 |
0.0000 |
0.0000 |
| Total Available Supply (MGD) |
0.0990 |
0.0990 |
0.0990 |
0.0990 |
0.0990 |
0.0990 |
| Service Area Demand |
0.0256 |
0.0336 |
0.0339 |
0.0347 |
0.0364 |
0.0375 |
| Sales |
0.0000 |
0.0000 |
0.0000 |
0.0000 |
0.0000 |
0.0000 |
| Future Sales |
0.0000 |
0.0000 |
0.0000 |
0.0000 |
0.0000 |
| Total Demand (MGD) |
0.0256 |
0.0336 |
0.0339 |
0.0347 |
0.0364 |
0.0375 |
| Demand as Percent of Supply |
26% |
34% |
34% |
35% |
37% |
38% |

The purpose of the above chart is to show a general indication of how the long-term per capita water demand changes over time. The per capita water demand may actually be different than indicated due to seasonal populations and the accuracy of data submitted. Water systems that have calculated long-term per capita water demand based on a methodology that produces different results may submit their information in the notes field.
Your long-term water demand is 58 gallons per capita per day. What demand management practices do you plan to implement to reduce the per capita water demand (i.e. conduct regular water audits, implement a plumbing retrofit program, employ practices such as rainwater harvesting or reclaimed water)? If these practices are covered elsewhere in your plan, indicate where the practices are discussed here.
No Changes
Are there other demand management practices you will implement to reduce your future supply needs? None at this Time
What supplies other than the ones listed in future supplies are being considered to meet your future supply needs? None at this Time
How does the water system intend to implement the demand management and supply planning components above? No plans at this time
Additional Information
Has this system participated in regional water supply or water use planning? No
What major water supply reports or studies were used for planning?
Please describe any other needs or issues regarding your water supply sources, any water system deficiencies or needed improvements (storage, treatment, etc.) or your ability to meet present and future water needs. Include both quantity and quality considerations, as well as financial, technical, managerial, permitting, and compliance issues:
The Division of Water Resources (DWR) provides the data contained within this
Local Water Supply Plan (LWSP) as a courtesy and service to our customers.
DWR staff does not field verify data. Neither DWR, nor any other party
involved in the preparation of this LWSP attests that the data is completely
free of errors and omissions. Furthermore, data users are cautioned that
LWSPs labeled PROVISIONAL have yet to be reviewed by DWR staff. Subsequent
review may result in significant revision. Questions regarding the accuracy
or limitations of usage of this data should be directed to the water system
and/or DWR.
|