|
The Division of Water Resources (DWR) provides the data contained within this
Local Water Supply Plan (LWSP) as a courtesy and service to our customers.
DWR staff does not field verify data. Neither DWR, nor any other party
involved in the preparation of this LWSP attests that the data is completely
free of errors and omissions. Furthermore, data users are cautioned that
LWSPs labeled PROVISIONAL have yet to be reviewed by DWR staff. Subsequent
review may result in significant revision. Questions regarding the accuracy
or limitations of usage of this data should be directed to the water system
and/or DWR.
1. System Information
Contact Information
Complete
| Water System Name: |
Two Rivers Utilities/Gastonia |
|
PWSID: |
01-36-010 |
| Mailing Address: | P.O. Box 1748
Gastonia, NC 28053 | Ownership: | Municipality |
| |
| Contact Person: | Kyle Butler | Title: | Utilities Engineer |
| Phone: | 704-866-6768 | Cell/Mobile: | 704-214-9078 |
Distribution System
| Line Type |
Size Range (Inches) |
Estimated % of lines |
| Asbestos Cement |
6-16 |
7.70 % |
| Cast Iron |
6-42 |
10.70 % |
| Ductile Iron |
6-36 |
46.30 % |
| Other |
All |
6.30 % |
| Polyvinyl Chloride |
2-10 |
29.00 % |
Line type information reporting is now based on GIS data that is available. The City has been making improvements to our GIS data on pipe material through recent AIA and Water Model projects. This methodology now represents the most accurate data.
The City of Gastonia is preparing to implement an AMI program that will replace all water meters in the system. Meter replacements were ceased in 2023 in anticipation of the AMI project. Programs
We continue to utilize our valve operation program that began in 2016. We have located and verified the operation of 11,287 valves through the end of 2023. Valves are GPS located and the data is mapped to our GIS system. The valve crew also has leak detection equipment available to help locate unseen leaks. Water Treatment Plant staff flow hydrants as needed for water quality. The fire department performs static pressure tests on hydrants throughout the year and reports any operational issues to our Utilities Maintenance Division for repairs. We are currently working on a funded project to implement an AMI system. As a part of the project all existing water meters are to be replaced by the end of 2026 with AMI capable water meters. Water Conservation
We have emergency water connections with the City of Belmont, the City of Bessemer City, and the Town of Dallas. Their system capacities and hydraulic gradient do not allow them to provide adequate supply to our system. 2. Water Use Information
Service Area
| Sub-Basin(s) | % of Service Population |
|---|
| South Fork Catawba River (03-2) | 67 % |
| Catawba River (03-1) | 33 % |
|
| County(s) | % of Service Population |
|---|
| Gaston | 100 % |
|
Service Area Zip file including shapefile uploaded Water Use by Type
| Type of Use |
Metered
Connections |
Metered
Average Use (MGD) |
Non-Metered
Connections |
Non-Metered
Estimated Use (MGD) |
| Residential |
31,366 |
4.4071 |
6 |
0.0009 |
| Commercial |
2,983 |
2.1127 |
26 |
0.0357 |
| Industrial |
119 |
0.6076 |
0 |
0.0000 |
| Institutional |
204 |
0.8489 |
0 |
0.0000 |
How much water was used for system processes (backwash, line cleaning, flushing, etc.)? 5.4895 MGD
Non-metered connections are for permitted hydrant usage for filling pools or water for construction sites that are billed through miscellaneous invoice. The Residential Non-metered connections consisted of (6) pool connections over (6) total days. The MGD represents the volume (316,000 gal.) over (365) days not (6) days to report in terms of MGD.
System Process Water includes 5.4895 MGD water to Rankin Lake for water quality. Some of the raw water pumped from Mountain Island Lake into Rankin Lake which is our raw water reservoir is used to maintain water levels and water quality. There is no other water supply to Rankin Lake. The remainder of the raw water is sent to the WTP for treatment.
Regarding the high amount of unaccounted-for water (22.79% of total supply) -- we continue to work to increase the accuracy of our internal reporting of filling and flushing new water lines and flushing for water quality. The valve operation crew continues to locate and verify the operation of the valves in our system as mentioned in Sections 1 and 5 of the report. Verification of the location and operation of our valves will reduce the response time and shut down of water lines when we have main breaks. We will continue to use our leak detection equipment to find and repair underground leaks. We are converting to an AMI system over the next 3 years. Water Sales
| Purchaser |
PWSID |
Average
Daily Sold
(MGD) |
Days
Used |
Contract |
Required to
comply with water
use restrictions? |
Pipe Size(s)
(Inches) |
Use
Type |
| MGD |
Expiration |
Recurring |
| Belmont |
01-36-015 |
0.0000 |
0 |
|
2020 |
Yes |
Yes |
12 |
Emergency |
| Bessemer City |
01-36-025 |
0.3898 |
184 |
1.7000 |
2028 |
No |
Yes |
12 |
Emergency |
| Clover, SC |
46-10-006 |
0.7846 |
365 |
1.0167 |
2045 |
Yes |
Yes |
16 |
Regular |
| Dallas/Spencer Mt Village |
01-36-065 |
0.0310 |
365 |
1.0000 |
2028 |
Yes |
Yes |
12 |
Regular |
| Lowell |
01-36-060 |
0.3658 |
365 |
0.6180 |
2029 |
Yes |
Yes |
12,6 |
Regular |
| McAdenville |
01-36-045 |
0.1980 |
365 |
1.0000 |
2030 |
Yes |
Yes |
16 |
Regular |
| Ranlo |
01-36-034 |
0.2941 |
365 |
0.6000 |
2040 |
Yes |
Yes |
8 |
Regular |
Bessemer City was billed over 6 periods in 2023 accounting for 184 days. The reported MGD was for the 184 days not 365. Contracted max sales is 1.7000 MGD.
Two Rivers confirmed a contracted sales limit of 1.067 MGD to Lowell, and Avg. Day sales of 0.3898 MGD to Bessemer City. 3. Water Supply Sources
Monthly Withdrawals & Purchases
|
Average Daily
Use (MGD) |
Max Day
Use (MGD) |
|
Average Daily
Use (MGD) |
Max Day
Use (MGD) |
|
Average Daily
Use (MGD) |
Max Day
Use (MGD) |
| Jan |
18.0000 |
18.0000 |
May |
18.0000 |
18.0000 |
Sep |
23.5993 |
27.6000 |
| Feb |
18.0000 |
18.0000 |
Jun |
18.0000 |
18.0000 |
Oct |
18.0000 |
18.0000 |
| Mar |
13.5542 |
18.0000 |
Jul |
20.7677 |
27.6000 |
Nov |
19.9460 |
27.6000 |
| Apr |
18.0000 |
18.0000 |
Aug |
26.5048 |
27.6000 |
Dec |
18.0000 |
18.0000 |

Surface Water Sources
| Stream |
Reservoir |
Average Daily Withdrawal |
Maximum Day
Withdrawal (MGD) |
Available Raw
Water Supply |
Usable On-Stream
Raw Water Supply
Storage (MG) |
| MGD |
Days Used |
MGD |
* Qualifier |
| Catawba River |
Mountain Island Lake |
19.2000 |
365 |
27.6000 |
75.0000 |
C |
8,601.0000 |
| South Fork Catawba River |
|
0.0000 |
0 |
0.0000 |
15.5000 |
F |
0.0000 |
* Qualifier: C=Contract Amount, SY20=20-year Safe Yield, SY50=50-year Safe Yield, F=20% of 7Q10 or other instream flow requirement, CUA=Capacity Use Area Permit
Surface Water Sources (continued)
| Stream |
Reservoir |
Drainage Area
(sq mi) |
Metered? |
Sub-Basin |
County |
Year
Offline |
Use
Type |
| Catawba River |
Mountain Island Lake |
1,819 |
Yes |
Catawba River (03-1) |
Gaston |
|
Regular |
| South Fork Catawba River |
|
560 |
No |
South Fork Catawba River (03-2) |
Gaston |
|
Emergency |
Existing sub-basin transfer between the South Fork Catawba and Catawba River will continue. Water Purchases From Other Systems
| Seller |
PWSID |
Average
Daily Purchased
(MGD) |
Days
Used |
Contract |
Required to
comply with water
use restrictions? |
Pipe Size(s)
(Inches) |
Use
Type |
| MGD |
Expiration |
Recurring |
| Belmont |
01-36-015 |
0.0000 |
0 |
0.0000 |
2020 |
Yes |
Yes |
12 |
Emergency |
| Bessemer City |
01-36-025 |
0.0000 |
0 |
0.0000 |
2028 |
Yes |
Yes |
12 |
Emergency |
| Dallas |
01-36-065 |
0.0000 |
0 |
0.0000 |
|
|
Yes |
12,10 |
Emergency |
Water Treatment Plants
| Plant Name |
Permitted Capacity
(MGD) |
Is Raw Water Metered? |
Is Finished Water Ouput Metered? |
Source |
| Gastonia WTP |
27.3000 |
Yes |
Yes |
Mountain Island Lk (Primary) SF Catawba Riv (Sec.) |
4. Wastewater Information
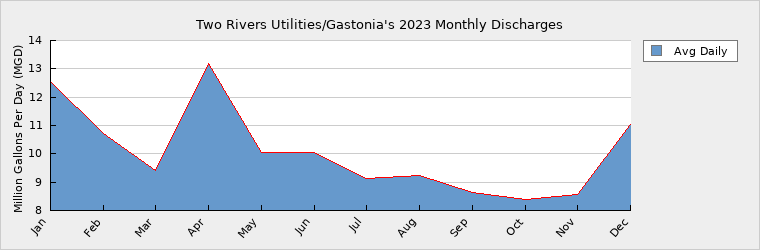
Monthly Discharges
|
Average Daily
Discharge (MGD) |
|
Average Daily
Discharge (MGD) |
|
Average Daily
Discharge (MGD) |
| Jan |
12.5700 |
May |
10.0600 |
Sep |
8.6200 |
| Feb |
10.7100 |
Jun |
10.0400 |
Oct |
8.3800 |
| Mar |
9.4100 |
Jul |
9.1300 |
Nov |
8.5800 |
| Apr |
13.1900 |
Aug |
9.2200 |
Dec |
11.0200 |
Wastewater Permits
| Permit Number |
Type |
Permitted Capacity
(MGD) |
Design Capacity
(MGD) |
Average Annual
Daily Discharge
(MGD) |
Maximum Day Discharge
(MGD) |
Receiving Stream |
Receiving Basin |
| NC0006033 |
WWTP |
4.0000 |
4.0000 |
0.7200 |
2.0900 |
South Fork Catawba River |
South Fork Catawba River (03-2) |
| NC0020184 |
WWTP |
16.0000 |
16.0000 |
6.7800 |
19.0000 |
South Fork Catawba River |
South Fork Catawba River (03-2) |
| NC0040070 |
WTP |
0.7500 |
1.2000 |
0.0000 |
0.4308 |
Unnamed Trib. to Long Creek |
South Fork Catawba River (03-2) |
| NC0074268 |
WWTP |
6.0000 |
6.0000 |
2.5700 |
9.8200 |
Crowders Creek |
Catawba River (03-1) |
| ND0084883 |
WWTP |
0.0000 |
0.0000 |
0.0000 |
0.0000 |
Land Application (SC) |
Catawba River (03-1) |
| WQ0001793 |
WWTP |
0.0000 |
0.0000 |
0.0000 |
0.0000 |
Land Application (NC) |
Catawba River (03-1) |
Land Application Permits - WQ0001793 applied 1,938 dry tons over 184 days in NC. ND0084883 applied 198 dry tons over 52 days in SC. There was no discharge to surface waters from NC0040070 in 2023. The wastewater from this facility was discharged to Long Creek WWTP for treatment and discharge. The Maximum Daily Discharge of 0.4038 MGD was calculated by averaging the highest monthly discharge. The max discharge data is collected by month and not daily. The maximum monthly discharge of 12.923 MG was divided by 30 days to get 0.4038 MGD. Wastewater Interconnections
| Water System |
PWSID |
Type |
Average Daily Amount |
Contract
Maximum (MGD) |
| MGD |
Days Used |
| Belmont |
01-36-015 |
Receiving |
0.0491 |
365 |
0.2800 |
| Bessemer City (Abernethy Creek) |
01-36-025 |
Receiving |
0.3898 |
365 |
0.6083 |
| Bessemer City (Oates Rd) |
01-36-025 |
Receiving |
0.3495 |
365 |
1.0000 |
| Clover |
46-10-006 |
Receiving |
0.6364 |
365 |
0.8667 |
| Dallas - SMV & LCA |
01-36-065 |
Receiving |
0.0561 |
365 |
0.6000 |
| High Shoals |
01-36-075 |
Receiving |
0.0267 |
365 |
0.1000 |
| Kings Mountain |
01-23-020 |
Receiving |
0.0125 |
365 |
1.0000 |
| Lowell |
01-36-060 |
Receiving |
0.0340 |
365 |
0.1500 |
| Ranlo |
01-36-034 |
Receiving |
0.2194 |
365 |
0.4000 |
| Town of McAdenville |
01-36-045 |
Receiving |
0.1300 |
365 |
0.1800 |
| Town of Stanley |
01-36-035 |
Receiving |
0.3801 |
365 |
1.0000 |
There are 2 permitted sewer connections with Bessemer City with separate contracts: Oates Rd with a contract maximum of 1 MGD and Abernethy Creek with a contract maximum of 0.6803 MGD. Two Rivers confirmed receiving an average of 0.3495 MGD and 0.3898 MGD of WW from Bessemer (Oates Rd) and Bessemer (Abernethy Creek), respectively, in 2023.
We have entered into an Sewer Connection agreement with Dallas. Flow began in 2023 and is reflected for the first time in the 2023 LWSP update. The maximum AD is 0.6000 MGD.
We also separately serve a small section of Dallas called Spencer Mountain Village and Long Creek Apartments. Those areas have been combined. Previous LWSP updates only reported the Spencer Mountain Village flow.
Kings Mountain has 2 metering points with very low flows that have been combined.
Stanley has 2 metering points that have been combined.
Two Rivers confirmed receiving an average of 0.0267 MGD of WW from High Shoals in 2023.
5. Planning
Projections
| |
2023 |
2030 |
2040 |
2050 |
2060 |
2070 |
| Year-Round Population |
93,877 |
102,686 |
115,075 |
129,358 |
146,033 |
165,325 |
| Seasonal Population |
0 |
0 |
0 |
0 |
0 |
0 |
| |
| Residential |
4.4080 |
4.7254 |
5.2191 |
5.7657 |
6.3718 |
7.0378 |
| Commercial |
2.1484 |
2.3031 |
2.5437 |
2.8101 |
3.1055 |
3.4301 |
| Industrial |
0.6076 |
0.6513 |
0.7194 |
0.7947 |
0.8783 |
0.9701 |
| Institutional |
0.8489 |
0.9100 |
1.0051 |
1.1104 |
1.2271 |
1.3554 |
| System Process |
5.4895 |
5.2702 |
4.9979 |
4.7797 |
4.6134 |
4.4956 |
| Unaccounted-for |
3.8276 |
3.9290 |
4.1062 |
4.3260 |
4.5912 |
4.9010 |
A 1.0% yearly increase (compounded annually) in water use projections is based on the projected 1.0% annual population growth in Gaston County, City of Gastonia, and Cramerton.
Demand v/s Percent of Supply
| |
2023 |
2030 |
2040 |
2050 |
2060 |
2070 |
| Surface Water Supply |
75.0000 |
75.0000 |
75.0000 |
75.0000 |
75.0000 |
75.0000 |
| Ground Water Supply |
0.0000 |
0.0000 |
0.0000 |
0.0000 |
0.0000 |
0.0000 |
| Purchases |
0.0000 |
0.0000 |
0.0000 |
0.0000 |
0.0000 |
0.0000 |
| Future Supplies |
0.0000 |
0.0000 |
0.0000 |
0.0000 |
0.0000 |
| Total Available Supply (MGD) |
75.0000 |
75.0000 |
75.0000 |
75.0000 |
75.0000 |
75.0000 |
| Service Area Demand |
17.3300 |
17.7890 |
18.5914 |
19.5866 |
20.7873 |
22.1900 |
| Sales |
1.8700 |
4.2347 |
4.2347 |
4.2347 |
4.2347 |
4.2347 |
| Future Sales |
0.0000 |
0.0000 |
0.0000 |
0.0000 |
0.0000 |
| Total Demand (MGD) |
19.2000 |
22.0237 |
22.8261 |
23.8213 |
25.0220 |
26.4247 |
| Demand as Percent of Supply |
26% |
29% |
30% |
32% |
33% |
35% |

The purpose of the above chart is to show a general indication of how the long-term per capita water demand changes over time. The per capita water demand may actually be different than indicated due to seasonal populations and the accuracy of data submitted. Water systems that have calculated long-term per capita water demand based on a methodology that produces different results may submit their information in the notes field.
Your long-term water demand is 47 gallons per capita per day. What demand management practices do you plan to implement to reduce the per capita water demand (i.e. conduct regular water audits, implement a plumbing retrofit program, employ practices such as rainwater harvesting or reclaimed water)? If these practices are covered elsewhere in your plan, indicate where the practices are discussed here.
Are there other demand management practices you will implement to reduce your future supply needs? We will continue to use an increasing block rate for residential and irrigation water use to promote conservation. We will continue to use our leak detection equipment to locate and repair leaks. We are replacing all water meters with AMI in the next 3 years.
What supplies other than the ones listed in future supplies are being considered to meet your future supply needs? The water supply at Mountain Island Lake will meet our needs into the future. Our current permit is for an average daily withdrawal of 75 MGD.
How does the water system intend to implement the demand management and supply planning components above? We will continue to use an increasing block rate structure and a full cost recovery rate structure. We will continue our leak detection program and meter testing and change-out programs. We will monitor our per capita water use annually as we update the LWSP in order to work to reduce our per capita water use.
Additional Information
Has this system participated in regional water supply or water use planning? Yes, Yes. We participate in the Catawba Wateree Water Management Group and the Catawba Wateree Drought Management Group with other water purveyors in the Catawba Wateree Basin.
What major water supply reports or studies were used for planning? We participated in the development of the Catawba Wateree Basin Master Plan. By participating in the Water Management Advisory Group and the DMAG, we have access to reports showing the water flow information and the available water supply in the Catawba River above our intake on Mountain Island Lake. We follow the Low Flow Protocol from the DMAG to determine what level of water conservation may be needed.
Please describe any other needs or issues regarding your water supply sources, any water system deficiencies or needed improvements (storage, treatment, etc.) or your ability to meet present and future water needs. Include both quantity and quality considerations, as well as financial, technical, managerial, permitting, and compliance issues: Protection of the water quality in our water supply on Mountain Island Lake. Funding assistance to allow further regionalization of the utility systems in Gaston County. The possible impacts of inter-basin transfer regulations on our water supplies from the Catawba River Basin and Mountain Island Lake. Adequate funding sources that support operations, capital improvements and a comprehensive long-term water supply master plan, in order to maintain and expand the water system to meet the needs of our customers and the future needs of Gaston County.
The Division of Water Resources (DWR) provides the data contained within this
Local Water Supply Plan (LWSP) as a courtesy and service to our customers.
DWR staff does not field verify data. Neither DWR, nor any other party
involved in the preparation of this LWSP attests that the data is completely
free of errors and omissions. Furthermore, data users are cautioned that
LWSPs labeled PROVISIONAL have yet to be reviewed by DWR staff. Subsequent
review may result in significant revision. Questions regarding the accuracy
or limitations of usage of this data should be directed to the water system
and/or DWR.
|