|
The Division of Water Resources (DWR) provides the data contained within this
Local Water Supply Plan (LWSP) as a courtesy and service to our customers.
DWR staff does not field verify data. Neither DWR, nor any other party
involved in the preparation of this LWSP attests that the data is completely
free of errors and omissions. Furthermore, data users are cautioned that
LWSPs labeled PROVISIONAL have yet to be reviewed by DWR staff. Subsequent
review may result in significant revision. Questions regarding the accuracy
or limitations of usage of this data should be directed to the water system
and/or DWR.
1. System Information
Contact Information
Complete
| Water System Name: |
Bessemer City |
|
PWSID: |
01-36-025 |
| Mailing Address: | 125 E. Virginia Avenue
Bessemer City, NC 28016 | Ownership: | Municipality |
| |
| Contact Person: | Dennis Wells | Title: | Water Plant ORC |
| Phone: | 704-629-5684 | Cell/Mobile: | 704-473-5371 |
| |
| Secondary Contact: | Jamie Ramsey ( PW Director) | | Phone: | 704-729-6529 |
| Mailing Address: | 125 E. Virginia Ave
Bessemer City, NC 28016 | Cell/Mobile: | 704-473-5371 |
Distribution System
| Line Type |
Size Range (Inches) |
Estimated % of lines |
| Asbestos Cement |
6 |
10.00 % |
| Cast Iron |
4-12 |
20.00 % |
| Ductile Iron |
4-12 |
42.00 % |
| Galvanized Iron |
.75-2 |
1.00 % |
| Polyvinyl Chloride |
2-16 |
27.00 % |
Programs
Water Conservation
2. Water Use Information
Service Area
| Sub-Basin(s) | % of Service Population |
|---|
| South Fork Catawba River (03-2) | 76 % |
| Catawba River (03-1) | 24 % |
|
| County(s) | % of Service Population |
|---|
| Gaston | 100 % |
|
Water Use by Type
| Type of Use |
Metered
Connections |
Metered
Average Use (MGD) |
Non-Metered
Connections |
Non-Metered
Estimated Use (MGD) |
| Residential |
2,293 |
0.2695 |
0 |
0.0000 |
| Commercial |
187 |
0.0578 |
0 |
0.0000 |
| Industrial |
3 |
0.5080 |
0 |
0.0000 |
| Institutional |
0 |
0.0000 |
0 |
0.0000 |
How much water was used for system processes (backwash, line cleaning, flushing, etc.)? 0.0852 MGD
Our billing department does not separate the Commercial and the Institutional Customers. The Institutional Customers are included in the Commercial Customers. 3. Water Supply Sources
Monthly Withdrawals & Purchases
|
Average Daily
Use (MGD) |
Max Day
Use (MGD) |
|
Average Daily
Use (MGD) |
Max Day
Use (MGD) |
|
Average Daily
Use (MGD) |
Max Day
Use (MGD) |
| Jan |
1.0036 |
1.4110 |
May |
1.0827 |
1.3986 |
Sep |
1.1771 |
1.5107 |
| Feb |
1.0399 |
1.4036 |
Jun |
1.0827 |
1.3708 |
Oct |
1.1722 |
2.0021 |
| Mar |
1.0075 |
1.4390 |
Jul |
1.2161 |
1.4800 |
Nov |
1.0939 |
1.4744 |
| Apr |
1.0427 |
1.1866 |
Aug |
1.1831 |
1.5787 |
Dec |
1.0865 |
1.2927 |

Surface Water Sources
| Stream |
Reservoir |
Average Daily Withdrawal |
Maximum Day
Withdrawal (MGD) |
Available Raw
Water Supply |
Usable On-Stream
Raw Water Supply
Storage (MG) |
| MGD |
Days Used |
MGD |
* Qualifier |
| Long Creek |
Arrowood |
1.0827 |
364 |
1.2611 |
2.7764 |
SY20 |
0.0000 |
* Qualifier: C=Contract Amount, SY20=20-year Safe Yield, SY50=50-year Safe Yield, F=20% of 7Q10 or other instream flow requirement, CUA=Capacity Use Area Permit
Surface Water Sources (continued)
| Stream |
Reservoir |
Drainage Area
(sq mi) |
Metered? |
Sub-Basin |
County |
Year
Offline |
Use
Type |
| Long Creek |
Arrowood |
12 |
No |
South Fork Catawba River (03-2) |
Gaston |
|
Regular |
Water Purchases From Other Systems
| Seller |
PWSID |
Average
Daily Purchased
(MGD) |
Days
Used |
Contract |
Required to
comply with water
use restrictions? |
Pipe Size(s)
(Inches) |
Use
Type |
| MGD |
Expiration |
Recurring |
| Gastonia |
01-36-010 |
1.5550 |
1 |
1.6080 |
|
No |
Yes |
12 |
Emergency |
| Kings Mountain |
01-23-020 |
0.0000 |
0 |
|
|
Yes |
Yes |
12 |
Emergency |
We purchased water from Gastonia on May 24th and December 30th, 2025.
Gastonia's bill does not show any uses in December. On December 30th our bleach feed line had a blockage and we were down for a few hours and we went on Gastonia at 3:00 PM and had the repair completed before 6:00 PM. Because of their billing cycle they will probably show that we purchased water for 31 to 62 days. The water we used on 12/30/2025 will probably be billed the nest time we purchase water from them. We went and read the meter and it shows us using 69531 gallons, Water Treatment Plants
| Plant Name |
Permitted Capacity
(MGD) |
Is Raw Water Metered? |
Is Finished Water Ouput Metered? |
Source |
| J.V. Tarpley WT Facility |
3.0000 |
Yes |
Yes |
Long Creek, Webber Reservoir, Arrowood Reservoir |
4. Wastewater Information
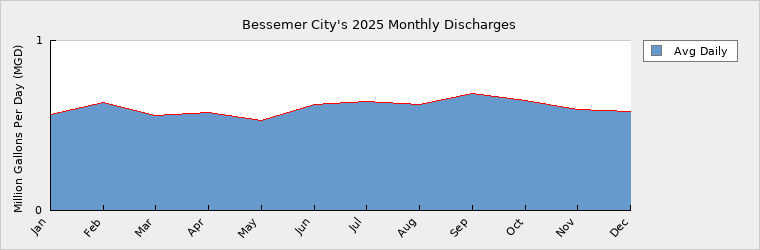
Monthly Discharges
|
Average Daily
Discharge (MGD) |
|
Average Daily
Discharge (MGD) |
|
Average Daily
Discharge (MGD) |
| Jan |
0.5644 |
May |
0.5268 |
Sep |
0.6890 |
| Feb |
0.6345 |
Jun |
0.6260 |
Oct |
0.6487 |
| Mar |
0.5573 |
Jul |
0.6397 |
Nov |
0.5955 |
| Apr |
0.5792 |
Aug |
0.6247 |
Dec |
0.5813 |
Bessemer City has 2 permitted sewer connection with Two River Utilities with separate contracts. 1) Oates Rd. with a contract for 1.0000 MGD and 2) Abernethy Creek with a contract for .6080 MGD. Wastewater Interconnections
| Water System |
PWSID |
Type |
Average Daily Amount |
Contract
Maximum (MGD) |
| MGD |
Days Used |
| Two Rivers-Gastonia |
01-36-010 |
Discharging |
0.6056 |
365 |
1.6080 |
There are 2 permitted sewer connections with Bessemer City with separate contracts: Oates Rd with a contract maximum of 1 MGD and an ADF of 0.3142 and Abernethy Creek with a contract maximum of 0.608 MGD and a ADF of 0.4235. Bessemer City reports the totals. 5. Planning
Projections
| |
2025 |
2030 |
2040 |
2050 |
2060 |
2070 |
| Year-Round Population |
5,730 |
5,736 |
5,802 |
5,912 |
6,020 |
6,132 |
| Seasonal Population |
0 |
0 |
0 |
0 |
0 |
0 |
| |
| Residential |
0.2695 |
0.2650 |
0.2560 |
0.2600 |
0.2660 |
0.2700 |
| Commercial |
0.0578 |
0.0585 |
0.0600 |
0.0610 |
0.0620 |
0.0630 |
| Industrial |
0.5080 |
0.6330 |
0.6530 |
0.6700 |
0.6720 |
0.6730 |
| Institutional |
0.0000 |
0.0000 |
0.0000 |
0.0000 |
0.0000 |
0.0000 |
| System Process |
0.0852 |
0.1100 |
0.1122 |
0.1144 |
0.1167 |
0.1191 |
| Unaccounted-for |
0.1635 |
0.1850 |
0.1900 |
0.1950 |
0.2000 |
0.2050 |
Demand v/s Percent of Supply
| |
2025 |
2030 |
2040 |
2050 |
2060 |
2070 |
| Surface Water Supply |
2.7764 |
2.7764 |
2.7764 |
2.7764 |
2.7764 |
2.7764 |
| Ground Water Supply |
0.0000 |
0.0000 |
0.0000 |
0.0000 |
0.0000 |
0.0000 |
| Purchases |
0.0000 |
0.0000 |
0.0000 |
0.0000 |
0.0000 |
0.0000 |
| Future Supplies |
0.0000 |
0.0000 |
0.0000 |
0.0000 |
0.0000 |
| Total Available Supply (MGD) |
2.7764 |
2.7764 |
2.7764 |
2.7764 |
2.7764 |
2.7764 |
| Service Area Demand |
1.0840 |
1.2515 |
1.2712 |
1.3004 |
1.3167 |
1.3301 |
| Sales |
0.0000 |
0.0000 |
0.0000 |
0.0000 |
0.0000 |
0.0000 |
| Future Sales |
0.0000 |
0.0000 |
0.0000 |
0.0000 |
0.0000 |
| Total Demand (MGD) |
1.0840 |
1.2515 |
1.2712 |
1.3004 |
1.3167 |
1.3301 |
| Demand as Percent of Supply |
39% |
45% |
46% |
47% |
47% |
48% |

The purpose of the above chart is to show a general indication of how the long-term per capita water demand changes over time. The per capita water demand may actually be different than indicated due to seasonal populations and the accuracy of data submitted. Water systems that have calculated long-term per capita water demand based on a methodology that produces different results may submit their information in the notes field.
Your long-term water demand is 47 gallons per capita per day. What demand management practices do you plan to implement to reduce the per capita water demand (i.e. conduct regular water audits, implement a plumbing retrofit program, employ practices such as rainwater harvesting or reclaimed water)? If these practices are covered elsewhere in your plan, indicate where the practices are discussed here.
Are there other demand management practices you will implement to reduce your future supply needs?
What supplies other than the ones listed in future supplies are being considered to meet your future supply needs?
How does the water system intend to implement the demand management and supply planning components above?
Additional Information
Has this system participated in regional water supply or water use planning? No
What major water supply reports or studies were used for planning?
Please describe any other needs or issues regarding your water supply sources, any water system deficiencies or needed improvements (storage, treatment, etc.) or your ability to meet present and future water needs. Include both quantity and quality considerations, as well as financial, technical, managerial, permitting, and compliance issues:
The Division of Water Resources (DWR) provides the data contained within this
Local Water Supply Plan (LWSP) as a courtesy and service to our customers.
DWR staff does not field verify data. Neither DWR, nor any other party
involved in the preparation of this LWSP attests that the data is completely
free of errors and omissions. Furthermore, data users are cautioned that
LWSPs labeled PROVISIONAL have yet to be reviewed by DWR staff. Subsequent
review may result in significant revision. Questions regarding the accuracy
or limitations of usage of this data should be directed to the water system
and/or DWR.
|