|
The Division of Water Resources (DWR) provides the data contained within this
Local Water Supply Plan (LWSP) as a courtesy and service to our customers.
DWR staff does not field verify data. Neither DWR, nor any other party
involved in the preparation of this LWSP attests that the data is completely
free of errors and omissions. Furthermore, data users are cautioned that
LWSPs labeled PROVISIONAL have yet to be reviewed by DWR staff. Subsequent
review may result in significant revision. Questions regarding the accuracy
or limitations of usage of this data should be directed to the water system
and/or DWR.
1. System Information
Contact Information
Complete
| Water System Name: |
Bradfield Farms S/D |
|
PWSID: |
01-60-264 |
| Mailing Address: | P.O. Box 240908
Charlotte, NC 28224 | Ownership: | Business |
| |
| Contact Person: | Harshna Patel | Title: | Water Quality Coordinator |
| Phone: | 704-604-4974 | Cell/Mobile: | -- |
Distribution System
| Line Type |
Size Range (Inches) |
Estimated % of lines |
| Polyvinyl Chloride |
2-10 |
100.00 % |
Programs
The company's water accountability program tracks pumpage, known water loss (from system processes, identified leaks, etc.) and water sold to determine monthly unaccounted for water loss. Water produced is compared to water billed. Higher or unusual customer usage is flagged when compared to customer's usage history. With the AMI meters installed over past years, customers have ability to track water usage via their My Utility Account portal. These assists to track monthly use and compare it to previous periods to help reduce non-revenue water loss. Also, the AMI meters help detect leaks with unusual water usage activity.
Our company website provides resources on water conservation and guides on reading water meters and detecting leaks. Water Efficiency Rebate Program is also promoted via our website to help customers offset the cost of installing high-efficiency appliances. Additionally Annual Consumer Confidence Report includes tips on reducing nonessential water use and promoting water conservation. Water Conservation
Ground water production is currently sufficient to supply Bradfield Farms. Both Charlotte Water and the Town of Harrisburg have municipal water supplies close to Bradfield Farms and negotiating a purchased water connection may be an option if an additional source is needed. 2. Water Use Information
Service Area
| Sub-Basin(s) | % of Service Population |
|---|
| Rocky River (18-4) | 100 % |
|
| County(s) | % of Service Population |
|---|
| Mecklenburg | 87 % |
| Cabarrus | 13 % |
|
Population is determined by multiplying the number of water connections (less irrigation) by persons per household from census.gov 2020-2024 (Mecklenburg County) - 2.44 Water Use by Type
| Type of Use |
Metered
Connections |
Metered
Average Use (MGD) |
Non-Metered
Connections |
Non-Metered
Estimated Use (MGD) |
| Residential |
1,190 |
0.1829 |
0 |
0.0000 |
| Commercial |
6 |
0.0011 |
0 |
0.0000 |
| Industrial |
0 |
0.0000 |
0 |
0.0000 |
| Institutional |
0 |
0.0000 |
0 |
0.0000 |
How much water was used for system processes (backwash, line cleaning, flushing, etc.)? 0.0111 MGD
3. Water Supply Sources
Monthly Withdrawals & Purchases
|
Average Daily
Use (MGD) |
Max Day
Use (MGD) |
|
Average Daily
Use (MGD) |
Max Day
Use (MGD) |
|
Average Daily
Use (MGD) |
Max Day
Use (MGD) |
| Jan |
0.1982 |
0.2445 |
May |
0.1880 |
0.2083 |
Sep |
0.2167 |
0.2851 |
| Feb |
0.1860 |
0.2136 |
Jun |
0.1982 |
0.2394 |
Oct |
0.2380 |
0.4452 |
| Mar |
0.1886 |
0.2076 |
Jul |
0.2321 |
0.2656 |
Nov |
0.1925 |
0.2534 |
| Apr |
0.1887 |
0.2262 |
Aug |
0.2021 |
0.2519 |
Dec |
0.1712 |
0.2134 |

Ground Water Sources
| Name or Number |
Average Daily Withdrawal (MGD) |
Max Day Withdrawal (MGD) |
12-Hour Supply
(MGD) |
CUA Reduction |
Year Offline |
Use Type |
| MGD |
Days Used |
| Well #1 |
0.0400 |
346 |
0.1321 |
0.0770 |
|
|
Regular |
| Well #2 |
0.0143 |
364 |
0.0388 |
0.0420 |
|
|
Regular |
| Well #3 |
0.0233 |
364 |
0.0411 |
0.0830 |
|
|
Regular |
| Well #4 |
0.0273 |
364 |
0.0814 |
0.0740 |
|
|
Regular |
| Well #6 |
0.0256 |
364 |
0.0726 |
0.0490 |
|
|
Regular |
| Well #7 |
0.0311 |
311 |
0.0802 |
0.1080 |
|
|
Regular |
| Well 8 |
0.0224 |
283 |
0.0731 |
0.0360 |
|
|
Regular |
| Well 9 |
0.0362 |
282 |
0.1281 |
0.1510 |
|
|
Regular |
Ground Water Sources (continued)
| Name or Number |
Well Depth (Feet) |
Casing Depth
(Feet) |
Screen Depth (Feet) |
Well Diameter (Inches) |
Pump Intake Depth (Feet) |
Metered? |
| Top |
Bottom |
| Well #1 |
|
|
|
|
8 |
|
Yes |
| Well #2 |
|
|
|
|
8 |
378 |
Yes |
| Well #3 |
|
|
|
|
8 |
255 |
Yes |
| Well #4 |
|
|
|
|
8 |
441 |
Yes |
| Well #6 |
|
|
|
|
8 |
357 |
Yes |
| Well #7 |
|
|
|
|
8 |
315 |
Yes |
| Well 8 |
800 |
|
|
|
6 |
453 |
Yes |
| Well 9 |
475 |
|
|
|
6 |
67 |
Yes |
4. Wastewater Information
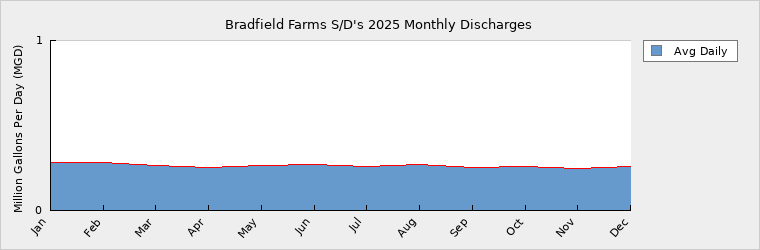
Monthly Discharges
|
Average Daily
Discharge (MGD) |
|
Average Daily
Discharge (MGD) |
|
Average Daily
Discharge (MGD) |
| Jan |
0.2827 |
May |
0.2630 |
Sep |
0.2525 |
| Feb |
0.2848 |
Jun |
0.2721 |
Oct |
0.2564 |
| Mar |
0.2619 |
Jul |
0.2599 |
Nov |
0.2459 |
| Apr |
0.2508 |
Aug |
0.2725 |
Dec |
0.2564 |
The wastewater treatment plant receives water from 166 "sewer only" connections that receive water from other sources. Wastewater Permits
| Permit Number |
Type |
Permitted Capacity
(MGD) |
Design Capacity
(MGD) |
Average Annual
Daily Discharge
(MGD) |
Maximum Day Discharge
(MGD) |
Receiving Stream |
Receiving Basin |
| NC0064734 |
WWTP |
0.4600 |
0.4600 |
0.2632 |
0.6240 |
McKee Creek |
Yadkin River (18-1) |
5. Planning
Projections
| |
2025 |
2030 |
2040 |
2050 |
2060 |
2070 |
| Year-Round Population |
2,906 |
2,911 |
2,917 |
2,922 |
2,927 |
2,933 |
| Seasonal Population |
0 |
0 |
0 |
0 |
0 |
0 |
| |
| Residential |
0.1829 |
0.1832 |
0.1836 |
0.1839 |
0.1842 |
0.1846 |
| Commercial |
0.0011 |
0.0012 |
0.0013 |
0.0015 |
0.0018 |
0.0022 |
| Industrial |
0.0000 |
0.0000 |
0.0000 |
0.0000 |
0.0000 |
0.0000 |
| Institutional |
0.0000 |
0.0000 |
0.0000 |
0.0000 |
0.0000 |
0.0000 |
| System Process |
0.0111 |
0.0047 |
0.0047 |
0.0047 |
0.0047 |
0.0047 |
| Unaccounted-for |
0.0049 |
0.0114 |
0.0113 |
0.0111 |
0.0109 |
0.0105 |
Demand v/s Percent of Supply
| |
2025 |
2030 |
2040 |
2050 |
2060 |
2070 |
| Surface Water Supply |
0.0000 |
0.0000 |
0.0000 |
0.0000 |
0.0000 |
0.0000 |
| Ground Water Supply |
0.6200 |
0.6200 |
0.6200 |
0.6200 |
0.6200 |
0.6200 |
| Purchases |
0.0000 |
0.0000 |
0.0000 |
0.0000 |
0.0000 |
0.0000 |
| Future Supplies |
0.0000 |
0.0000 |
0.0000 |
0.0000 |
0.0000 |
| Total Available Supply (MGD) |
0.6200 |
0.6200 |
0.6200 |
0.6200 |
0.6200 |
0.6200 |
| Service Area Demand |
0.2000 |
0.2005 |
0.2009 |
0.2012 |
0.2016 |
0.2020 |
| Sales |
0.0000 |
0.0000 |
0.0000 |
0.0000 |
0.0000 |
0.0000 |
| Future Sales |
0.0000 |
0.0000 |
0.0000 |
0.0000 |
0.0000 |
| Total Demand (MGD) |
0.2000 |
0.2005 |
0.2009 |
0.2012 |
0.2016 |
0.2020 |
| Demand as Percent of Supply |
32% |
32% |
32% |
32% |
33% |
33% |

The purpose of the above chart is to show a general indication of how the long-term per capita water demand changes over time. The per capita water demand may actually be different than indicated due to seasonal populations and the accuracy of data submitted. Water systems that have calculated long-term per capita water demand based on a methodology that produces different results may submit their information in the notes field.
Your long-term water demand is 63 gallons per capita per day. What demand management practices do you plan to implement to reduce the per capita water demand (i.e. conduct regular water audits, implement a plumbing retrofit program, employ practices such as rainwater harvesting or reclaimed water)? If these practices are covered elsewhere in your plan, indicate where the practices are discussed here.
No changes
Are there other demand management practices you will implement to reduce your future supply needs? We will continue to use the annual Consumer Confidence Report and our website to promote water conservation and Water Efficiency Rebate Program. Implement water loss detection services within the distribution system if needed.
What supplies other than the ones listed in future supplies are being considered to meet your future supply needs? Continue periodic review of the water demand at Bradfield Farms to identify in conjunction with system growth and/ or demand changes. These actions will help to ensure timely planning and execution of system expansions/improvements as needed.
How does the water system intend to implement the demand management and supply planning components above? We would pursue engineering design and state approval for any changes to our water supply.
Additional Information
Has this system participated in regional water supply or water use planning? No
What major water supply reports or studies were used for planning?
Please describe any other needs or issues regarding your water supply sources, any water system deficiencies or needed improvements (storage, treatment, etc.) or your ability to meet present and future water needs. Include both quantity and quality considerations, as well as financial, technical, managerial, permitting, and compliance issues:
The Division of Water Resources (DWR) provides the data contained within this
Local Water Supply Plan (LWSP) as a courtesy and service to our customers.
DWR staff does not field verify data. Neither DWR, nor any other party
involved in the preparation of this LWSP attests that the data is completely
free of errors and omissions. Furthermore, data users are cautioned that
LWSPs labeled PROVISIONAL have yet to be reviewed by DWR staff. Subsequent
review may result in significant revision. Questions regarding the accuracy
or limitations of usage of this data should be directed to the water system
and/or DWR.
|