|
The Division of Water Resources (DWR) provides the data contained within this
Local Water Supply Plan (LWSP) as a courtesy and service to our customers.
DWR staff does not field verify data. Neither DWR, nor any other party
involved in the preparation of this LWSP attests that the data is completely
free of errors and omissions. Furthermore, data users are cautioned that
LWSPs labeled PROVISIONAL have yet to be reviewed by DWR staff. Subsequent
review may result in significant revision. Questions regarding the accuracy
or limitations of usage of this data should be directed to the water system
and/or DWR.
1. System Information
Contact Information
Complete
| Water System Name: |
Laurinburg |
|
PWSID: |
03-83-010 |
| Mailing Address: | P.O. Box 249
Laurinburg, NC 28353 | Ownership: | Municipality |
| |
| Contact Person: | Dixon Medlin | Title: | Treatment Plant Director |
| Phone: | 910-291-1716 | Cell/Mobile: | 910-599-3165 |
| |
| Secondary Contact: | Marian Manis | | Phone: | 910-277-0214 |
| Mailing Address: | P.O. Box 249
Laurinburg, NC 28353 | Cell/Mobile: | 910-599-3165 |
Distribution System
| Line Type |
Size Range (Inches) |
Estimated % of lines |
| Asbestos Cement |
8-20 |
24.00 % |
| Cast Iron |
10 |
1.00 % |
| Ductile Iron |
12 |
4.00 % |
| Galvanized Iron |
6 |
1.00 % |
| Polyvinyl Chloride |
6-20 |
70.00 % |
Programs
Water Conservation
2. Water Use Information
Service Area
| Sub-Basin(s) | % of Service Population |
|---|
| Big Shoe Heel Creek (09-2) | 100 % |
|
| County(s) | % of Service Population |
|---|
| Scotland | 100 % |
|
Water Use by Type
| Type of Use |
Metered
Connections |
Metered
Average Use (MGD) |
Non-Metered
Connections |
Non-Metered
Estimated Use (MGD) |
| Residential |
6,698 |
1.0722 |
0 |
0.0000 |
| Commercial |
875 |
0.4981 |
0 |
0.0000 |
| Industrial |
0 |
0.0000 |
0 |
0.0000 |
| Institutional |
0 |
0.0000 |
0 |
0.0000 |
How much water was used for system processes (backwash, line cleaning, flushing, etc.)? 0.2000 MGD
Flushing dead end lines, WTP backwash filters, Fire hydrant testing.
Storm water and sewer line maintenance (Vac-trucks). Water Sales
| Purchaser |
PWSID |
Average
Daily Sold
(MGD) |
Days
Used |
Contract |
Required to
comply with water
use restrictions? |
Pipe Size(s)
(Inches) |
Use
Type |
| MGD |
Expiration |
Recurring |
| Barnes Bridge Rd/ DISTRICT 3 |
50-83-003 |
0.0336 |
365 |
0.0000 |
2025 |
Yes |
No |
12 |
Regular |
| GILLIS RD DIST 1 |
50-83-005 |
0.0659 |
365 |
0.0000 |
2025 |
Yes |
Yes |
12 |
Regular |
| Laurinburg-Maxton Airport |
03-83-107 |
0.0234 |
365 |
0.0000 |
|
Yes |
Yes |
|
Regular |
| Malloy Rd/DIST 4 |
50-83-004 |
0.0335 |
365 |
0.0000 |
2025 |
Yes |
Yes |
12 |
Regular |
| Scotland Co (South) DIST 2 |
03-83-035 |
0.1395 |
365 |
0.5000 |
2025 |
Yes |
Yes |
12 |
Regular |
Laurinburg provides water as needed to the Barnes Bridge, Gillis Hill, and Malloy Road systems. Accordingly, 0.3000 MGD of the 0.5000 MGD indicated for Scotland (South) serves as a placeholder demand for these three systems (0.1000 MGD each) so that these regular sales can be included in Laurinburg's total demands. This value has been taken from previous LWSPs. 3. Water Supply Sources
Monthly Withdrawals & Purchases
|
Average Daily
Use (MGD) |
Max Day
Use (MGD) |
|
Average Daily
Use (MGD) |
Max Day
Use (MGD) |
|
Average Daily
Use (MGD) |
Max Day
Use (MGD) |
| Jan |
2.6085 |
3.1800 |
May |
2.3524 |
2.6700 |
Sep |
2.4532 |
2.9800 |
| Feb |
2.2552 |
2.4100 |
Jun |
2.3905 |
2.7000 |
Oct |
2.3915 |
2.6200 |
| Mar |
2.1545 |
2.4600 |
Jul |
2.5567 |
3.3400 |
Nov |
2.2345 |
2.7800 |
| Apr |
2.1423 |
2.3900 |
Aug |
2.6130 |
3.5100 |
Dec |
2.1403 |
2.5600 |

Ground Water Sources
| Name or Number |
Average Daily Withdrawal (MGD) |
Max Day Withdrawal (MGD) |
12-Hour Supply
(MGD) |
CUA Reduction |
Year Offline |
Use Type |
| MGD |
Days Used |
| 10 |
0.2539 |
339 |
0.334 |
0.3340 |
|
|
Regular |
| 11 |
0.1283 |
301 |
0.169 |
0.1690 |
|
|
Regular |
| 14 |
0.2985 |
338 |
0.394 |
0.3940 |
|
|
Regular |
| 15 |
0.0000 |
0 |
|
0.4640 |
|
2023 |
Regular |
| 16 |
0.0855 |
45 |
0.113 |
0.1130 |
|
|
Regular |
| 17 |
0.0546 |
277 |
0.072 |
0.0720 |
|
|
Regular |
| 18 |
0.2539 |
340 |
0.334 |
0.3340 |
|
|
Regular |
| 19 |
0.2193 |
342 |
0.289 |
0.2890 |
|
|
Regular |
| 20 |
0.2439 |
312 |
0.322 |
0.3220 |
|
|
Regular |
| 21 |
0.1210 |
310 |
0.160 |
0.1600 |
|
|
Regular |
| 22 |
0.2985 |
311 |
0.393 |
0.3930 |
|
|
Regular |
| 23 |
0.1911 |
341 |
0.252 |
0.2520 |
|
|
Regular |
| 24 |
0.2457 |
336 |
0.324 |
0.3240 |
|
|
Regular |
| 5 |
0.2029 |
286 |
0.268 |
0.2680 |
|
|
Regular |
| 6 |
0.1256 |
336 |
0.166 |
0.1660 |
|
|
Regular |
Ground Water Sources (continued)
| Name or Number |
Well Depth (Feet) |
Casing Depth
(Feet) |
Screen Depth (Feet) |
Well Diameter (Inches) |
Pump Intake Depth (Feet) |
Metered? |
| Top |
Bottom |
| 10 |
175 |
80 |
80 |
122 |
10 |
125 |
Yes |
| 11 |
178 |
66 |
66 |
101 |
12 |
100 |
Yes |
| 14 |
188 |
180 |
120 |
170 |
10 |
120 |
Yes |
| 15 |
178 |
180 |
80 |
140 |
10 |
120 |
Yes |
| 16 |
148 |
180 |
80 |
140 |
10 |
125 |
Yes |
| 17 |
170 |
180 |
80 |
140 |
10 |
125 |
Yes |
| 18 |
169 |
180 |
98 |
145 |
10 |
125 |
Yes |
| 19 |
118 |
110 |
80 |
113 |
10 |
100 |
Yes |
| 20 |
165 |
56 |
85 |
149 |
12 |
114 |
No |
| 21 |
190 |
76 |
76 |
182 |
10 |
100 |
Yes |
| 22 |
135 |
81 |
64 |
134 |
10 |
100 |
Yes |
| 23 |
314 |
92 |
92 |
196 |
12 |
160 |
Yes |
| 24 |
200 |
101 |
101 |
197 |
12 |
150 |
No |
| 5 |
140 |
55 |
80 |
130 |
12 |
|
Yes |
| 6 |
210 |
80 |
80 |
196 |
10 |
110 |
Yes |
Water Purchases From Other Systems
| Seller |
PWSID |
Average
Daily Purchased
(MGD) |
Days
Used |
Contract |
Required to
comply with water
use restrictions? |
Pipe Size(s)
(Inches) |
Use
Type |
| MGD |
Expiration |
Recurring |
| Laurinburg-Maxton Airport |
03-83-107 |
0.0000 |
0 |
0.0000 |
|
No |
Yes |
12 |
Emergency |
Water Treatment Plants
| Plant Name |
Permitted Capacity
(MGD) |
Is Raw Water Metered? |
Is Finished Water Ouput Metered? |
Source |
| Laurinburg WTP |
8.0000 |
No |
Yes |
Ground Water |
4. Wastewater Information
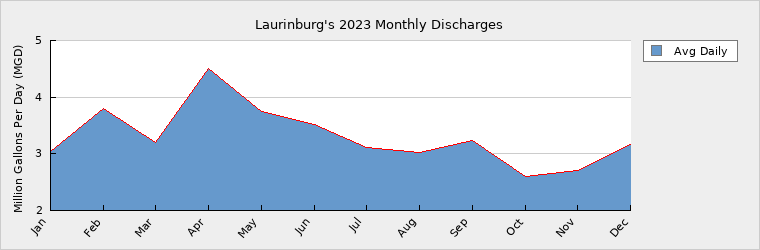
Monthly Discharges
|
Average Daily
Discharge (MGD) |
|
Average Daily
Discharge (MGD) |
|
Average Daily
Discharge (MGD) |
| Jan |
3.0400 |
May |
3.7500 |
Sep |
3.2400 |
| Feb |
3.8030 |
Jun |
3.5200 |
Oct |
2.6000 |
| Mar |
3.2060 |
Jul |
3.1100 |
Nov |
2.7000 |
| Apr |
4.5100 |
Aug |
3.0200 |
Dec |
3.1600 |
We are now in the process of building a new Influent pumpstation/headworks, hope to be online 2025. We also have plans for WWTP upgrades .in the near future. Wastewater Permits
| Permit Number |
Type |
Permitted Capacity
(MGD) |
Design Capacity
(MGD) |
Average Annual
Daily Discharge
(MGD) |
Maximum Day Discharge
(MGD) |
Receiving Stream |
Receiving Basin |
| NC0020656 |
WWTP |
4.0000 |
4.0000 |
3.3000 |
6.9000 |
Big Shoe Heel Creek |
Big Shoe Heel Creek (09-2) |
| NC0021661 |
WWTP |
0.0300 |
0.0300 |
0.0000 |
0.0000 |
Big Shoe Heel Creek |
Big Shoe Heel Creek (09-2) |
| NC0036773 |
WTP |
8.0000 |
8.0000 |
0.1000 |
0.1000 |
Big Branch Creek |
Big Shoe Heel Creek (09-2) |
THE 0.1000 MGD OF WASTEWATER DISCHARGED TO BIG BRANCH CREEK UNDER PERMIT NO. NC0036773 IS PROCESSED WATER FROM THE WTP WHICH IS NOT INCLUDED IN THE MONTHLY AVERAGES. 5. Planning
Projections
| |
2023 |
2030 |
2040 |
2050 |
2060 |
2070 |
| Year-Round Population |
18,288 |
18,300 |
18,320 |
18,330 |
18,340 |
18,350 |
| Seasonal Population |
0 |
0 |
0 |
0 |
0 |
0 |
| |
| Residential |
1.0722 |
1.1529 |
1.1542 |
1.1548 |
1.1554 |
1.1561 |
| Commercial |
0.4981 |
0.6000 |
0.6100 |
0.6200 |
0.6300 |
0.6400 |
| Industrial |
0.0000 |
0.0000 |
0.0000 |
0.0000 |
0.0000 |
0.0000 |
| Institutional |
0.0000 |
0.0000 |
0.0000 |
0.0000 |
0.0000 |
0.0000 |
| System Process |
0.2000 |
0.2000 |
0.2000 |
0.2000 |
0.2000 |
0.2000 |
| Unaccounted-for |
0.2907 |
0.4200 |
0.4200 |
0.4200 |
0.4200 |
0.4200 |
Future Supply Sources
| Source Name |
PWSID |
Source Type |
Additional Supply |
Year Online |
Year Offline |
Type |
| City of Laurinburg |
03-83-010 |
Ground |
0.6000 |
2026 |
|
Regular |
Demand v/s Percent of Supply
| |
2023 |
2030 |
2040 |
2050 |
2060 |
2070 |
| Surface Water Supply |
0.0000 |
0.0000 |
0.0000 |
0.0000 |
0.0000 |
0.0000 |
| Ground Water Supply |
4.0540 |
3.5900 |
3.5900 |
3.5900 |
3.5900 |
3.5900 |
| Purchases |
0.0000 |
0.0000 |
0.0000 |
0.0000 |
0.0000 |
0.0000 |
| Future Supplies |
0.6000 |
0.6000 |
0.6000 |
0.6000 |
0.6000 |
| Total Available Supply (MGD) |
4.0540 |
4.1900 |
4.1900 |
4.1900 |
4.1900 |
4.1900 |
| Service Area Demand |
2.0610 |
2.3729 |
2.3842 |
2.3948 |
2.4054 |
2.4161 |
| Sales |
0.2959 |
0.6564 |
0.6564 |
0.6564 |
0.6564 |
0.6564 |
| Future Sales |
0.0000 |
0.0000 |
0.0000 |
0.0000 |
0.0000 |
| Total Demand (MGD) |
2.3569 |
3.0293 |
3.0406 |
3.0512 |
3.0618 |
3.0725 |
| Demand as Percent of Supply |
58% |
72% |
73% |
73% |
73% |
73% |

The purpose of the above chart is to show a general indication of how the long-term per capita water demand changes over time. The per capita water demand may actually be different than indicated due to seasonal populations and the accuracy of data submitted. Water systems that have calculated long-term per capita water demand based on a methodology that produces different results may submit their information in the notes field.
Your long-term water demand is 59 gallons per capita per day. What demand management practices do you plan to implement to reduce the per capita water demand (i.e. conduct regular water audits, implement a plumbing retrofit program, employ practices such as rainwater harvesting or reclaimed water)? If these practices are covered elsewhere in your plan, indicate where the practices are discussed here.
Are there other demand management practices you will implement to reduce your future supply needs?
What supplies other than the ones listed in future supplies are being considered to meet your future supply needs? The city is the process of adding additional wells and raw water piping system upgrades. We are conducting an AIA study of the entire treatment system as well.
How does the water system intend to implement the demand management and supply planning components above?
Additional Information
Has this system participated in regional water supply or water use planning? No
What major water supply reports or studies were used for planning?
Please describe any other needs or issues regarding your water supply sources, any water system deficiencies or needed improvements (storage, treatment, etc.) or your ability to meet present and future water needs. Include both quantity and quality considerations, as well as financial, technical, managerial, permitting, and compliance issues:
The Division of Water Resources (DWR) provides the data contained within this
Local Water Supply Plan (LWSP) as a courtesy and service to our customers.
DWR staff does not field verify data. Neither DWR, nor any other party
involved in the preparation of this LWSP attests that the data is completely
free of errors and omissions. Furthermore, data users are cautioned that
LWSPs labeled PROVISIONAL have yet to be reviewed by DWR staff. Subsequent
review may result in significant revision. Questions regarding the accuracy
or limitations of usage of this data should be directed to the water system
and/or DWR.
|