|
The Division of Water Resources (DWR) provides the data contained within this
Local Water Supply Plan (LWSP) as a courtesy and service to our customers.
DWR staff does not field verify data. Neither DWR, nor any other party
involved in the preparation of this LWSP attests that the data is completely
free of errors and omissions. Furthermore, data users are cautioned that
LWSPs labeled PROVISIONAL have yet to be reviewed by DWR staff. Subsequent
review may result in significant revision. Questions regarding the accuracy
or limitations of usage of this data should be directed to the water system
and/or DWR.
1. System Information
Contact Information
Complete
| Water System Name: |
Ocracoke Sanitary District |
|
PWSID: |
04-48-020 |
| Mailing Address: | P.O. Box 567
Ocracoke, NC 27960 | Ownership: | District |
| |
| Contact Person: | Earl H. Gaskins | Title: | Plant and Systems Manager |
| Phone: | 252-928-5791 | Cell/Mobile: | -- |
| |
| Secondary Contact: | Janie M. Garrish | | Phone: | 252-928-5791 |
| Mailing Address: | P. O. Box 567
Ocracoke, NC 27960-0567 | Cell/Mobile: | -- |
Distribution System
| Line Type |
Size Range (Inches) |
Estimated % of lines |
| Polyvinyl Chloride |
2-10 |
100.00 % |
Programs
LINE INSPECTION, COMPARISON OF MONTLHY CONSUMPTION TO MONTHLY PRODUCTION Water Conservation
OCRACOKE IS AN ISLAND OFF THE COAST OF NC & WE ARE ACCESSIBLE ONLY BY FERRY( ATLANTIC OCEAN ON ONE SIDE,PAMLICO
SOUND ON OTHER HATTERAS AND OCRACOKE INTLETS ON EITHER END) THERE IS NO FEASIBLE WAY TO PHYSICALLY CONNECT
WITH ANY OTHER WATER SYSTEM. 2. Water Use Information
Service Area
| Sub-Basin(s) | % of Service Population |
|---|
| Pamlico River & Sound (15-3) | 100 % |
|
| County(s) | % of Service Population |
|---|
| Hyde | 100 % |
|
Water Use by Type
| Type of Use |
Metered
Connections |
Metered
Average Use (MGD) |
Non-Metered
Connections |
Non-Metered
Estimated Use (MGD) |
| Residential |
1,133 |
0.0500 |
0 |
0.0000 |
| Commercial |
172 |
0.0494 |
0 |
0.0000 |
| Industrial |
0 |
0.0000 |
0 |
0.0000 |
| Institutional |
15 |
0.0100 |
0 |
0.0000 |
How much water was used for system processes (backwash, line cleaning, flushing, etc.)? 0.1300 MGD
OCRACOKE SANITARY DISTRICT SYSTEM PROCESS WATER IS REJECT WATER FROM THE REVERSE OSMOSIS PLANT WHICH
HAS 65% RECOVERY RATE FOR EVERY 100 GALLOSN PUMPED FROM WELLS. THIS CAN VARY SLIGHTLY. 3. Water Supply Sources
Monthly Withdrawals & Purchases
|
Average Daily
Use (MGD) |
Max Day
Use (MGD) |
|
Average Daily
Use (MGD) |
Max Day
Use (MGD) |
|
Average Daily
Use (MGD) |
Max Day
Use (MGD) |
| Jan |
0.1433 |
0.2330 |
May |
0.2753 |
0.3280 |
Sep |
0.3172 |
0.4510 |
| Feb |
0.1273 |
0.1600 |
Jun |
0.3809 |
0.4970 |
Oct |
0.2863 |
0.3470 |
| Mar |
0.1675 |
0.2220 |
Jul |
0.4453 |
0.5790 |
Nov |
0.2249 |
0.2960 |
| Apr |
0.2295 |
0.2940 |
Aug |
0.4020 |
0.5870 |
Dec |
0.1750 |
0.3330 |
OCRACOKE SANITARY DISTRICT HAS 3 WELLS BUT ONLY USE ONE AT A TIME AND USUALLY ONLY ONE PER DAY BUT
IF PLANT HAS TO RUN TWICE IN ONE DAY MAY RUN ON DIFFERENT WELL SECOND TIME. 
Ground Water Sources
| Name or Number |
Average Daily Withdrawal (MGD) |
Max Day Withdrawal (MGD) |
12-Hour Supply
(MGD) |
CUA Reduction |
Year Offline |
Use Type |
| MGD |
Days Used |
| 1 |
0.0000 |
0 |
0 |
0.4320 |
|
|
Regular |
| 2 |
0.2544 |
179 |
0.5870 |
0.7200 |
|
|
Regular |
| 3 |
0.2725 |
187 |
0.5640 |
0.7200 |
|
|
Regular |
Ground Water Sources (continued)
| Name or Number |
Well Depth (Feet) |
Casing Depth
(Feet) |
Screen Depth (Feet) |
Well Diameter (Inches) |
Pump Intake Depth (Feet) |
Metered? |
| Top |
Bottom |
| 1 |
622 |
603 |
603 |
622 |
8 |
40 |
Yes |
| 2 |
640 |
605 |
605 |
640 |
10 |
80 |
Yes |
| 3 |
622 |
602 |
602 |
622 |
10 |
80 |
Yes |
WELL #1 IS ACTIVE BUT NOT USED OFTEN BECAUSE IT WILL ONLY RUN PART OF THE PLANT
DUE TO PIPE SIZE AND FLOW. Water Treatment Plants
| Plant Name |
Permitted Capacity
(MGD) |
Is Raw Water Metered? |
Is Finished Water Ouput Metered? |
Source |
| Ocracoke Sanitary District |
0.8500 |
Yes |
Yes |
Well #1, #2 & #3Castle Hayne Aquifer. |
4. Wastewater Information
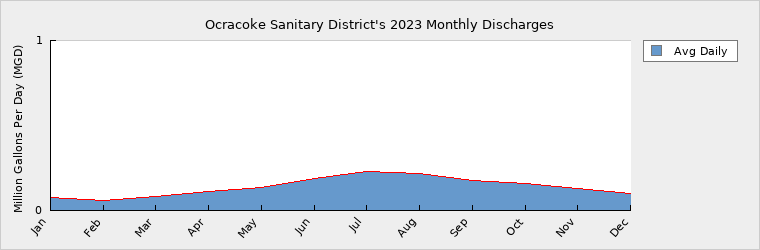
Monthly Discharges
|
Average Daily
Discharge (MGD) |
|
Average Daily
Discharge (MGD) |
|
Average Daily
Discharge (MGD) |
| Jan |
0.0753 |
May |
0.1331 |
Sep |
0.1755 |
| Feb |
0.0617 |
Jun |
0.1872 |
Oct |
0.1567 |
| Mar |
0.0819 |
Jul |
0.2271 |
Nov |
0.1283 |
| Apr |
0.1100 |
Aug |
0.2197 |
Dec |
0.1011 |
OCRACOKE HAS NO WASTEWATER TREATMENT PLANT ONLY SEPTIC SYSTEMS AND DRAIN FIELDS WHICH ARE REGULATED
AND PERMITED BY HYDE COUNTY HEALTH DEPARTMENT. OCRACOKE SANITARY DISTRICTS ONLY OPERATES THE WATER SYSTEM. Wastewater Permits
| Permit Number |
Type |
Permitted Capacity
(MGD) |
Design Capacity
(MGD) |
Average Annual
Daily Discharge
(MGD) |
Maximum Day Discharge
(MGD) |
Receiving Stream |
Receiving Basin |
| NC0041530 |
WTP |
0.4500 |
0.0000 |
0.1400 |
0.3264 |
Pamlico Sound |
Pamlico River & Sound (15-3) |
5. Planning
Projections
| |
2023 |
2030 |
2040 |
2050 |
2060 |
2070 |
| Year-Round Population |
900 |
900 |
910 |
905 |
915 |
915 |
| Seasonal Population |
16,000 |
16,000 |
16,000 |
16,500 |
16,500 |
16,500 |
| |
| Residential |
0.0500 |
0.0500 |
0.0510 |
0.0490 |
0.0500 |
0.0500 |
| Commercial |
0.0494 |
0.0494 |
0.0490 |
0.0470 |
0.0480 |
0.0485 |
| Industrial |
0.0000 |
0.0000 |
0.0000 |
0.0000 |
0.0000 |
0.0000 |
| Institutional |
0.0100 |
0.0100 |
0.0100 |
0.0090 |
0.0100 |
0.0100 |
| System Process |
0.1300 |
0.1300 |
0.1300 |
0.1200 |
0.1300 |
0.1300 |
| Unaccounted-for |
0.0250 |
0.0250 |
0.0260 |
0.0230 |
0.0240 |
0.0230 |
WEATHER CAN HAVE A BIG IMPACT ON SEASONAL POPULTION, FERRY SCHEDULES AND ROAD OVERWASH CAN ALSO IMPACT
THIS. Demand v/s Percent of Supply
| |
2023 |
2030 |
2040 |
2050 |
2060 |
2070 |
| Surface Water Supply |
0.0000 |
0.0000 |
0.0000 |
0.0000 |
0.0000 |
0.0000 |
| Ground Water Supply |
1.8720 |
1.8720 |
1.8720 |
1.8720 |
1.8720 |
1.8720 |
| Purchases |
0.0000 |
0.0000 |
0.0000 |
0.0000 |
0.0000 |
0.0000 |
| Future Supplies |
0.0000 |
0.0000 |
0.0000 |
0.0000 |
0.0000 |
| Total Available Supply (MGD) |
1.8720 |
1.8720 |
1.8720 |
1.8720 |
1.8720 |
1.8720 |
| Service Area Demand |
0.2644 |
0.2644 |
0.2660 |
0.2480 |
0.2620 |
0.2615 |
| Sales |
0.0000 |
0.0000 |
0.0000 |
0.0000 |
0.0000 |
0.0000 |
| Future Sales |
0.0000 |
0.0000 |
0.0000 |
0.0000 |
0.0000 |
| Total Demand (MGD) |
0.2644 |
0.2644 |
0.2660 |
0.2480 |
0.2620 |
0.2615 |
| Demand as Percent of Supply |
14% |
14% |
14% |
13% |
14% |
14% |

The purpose of the above chart is to show a general indication of how the long-term per capita water demand changes over time. The per capita water demand may actually be different than indicated due to seasonal populations and the accuracy of data submitted. Water systems that have calculated long-term per capita water demand based on a methodology that produces different results may submit their information in the notes field.
Your long-term water demand is 56 gallons per capita per day. What demand management practices do you plan to implement to reduce the per capita water demand (i.e. conduct regular water audits, implement a plumbing retrofit program, employ practices such as rainwater harvesting or reclaimed water)? If these practices are covered elsewhere in your plan, indicate where the practices are discussed here.
NO CHANGES HERE
Are there other demand management practices you will implement to reduce your future supply needs?
What supplies other than the ones listed in future supplies are being considered to meet your future supply needs? OCRAOCKE SANITARY DISTRICT HAS RECEIVED FUNDING TO REPLACE ALL OLD FIRE HYDRANTS, DO A STUDY ON AGING EQUIPMENT
& TO BUILD NEW WATER TOWER TO REPLACE THE ONE THAT WAS BUILT IN LATE 1976- EARLY 1977. ENGINEERING PLANS HAVE TO
TO DEQ AND WE ARE WAITING FOR APPROVAL.
How does the water system intend to implement the demand management and supply planning components above?
Additional Information
Has this system participated in regional water supply or water use planning? No
What major water supply reports or studies were used for planning?
Please describe any other needs or issues regarding your water supply sources, any water system deficiencies or needed improvements (storage, treatment, etc.) or your ability to meet present and future water needs. Include both quantity and quality considerations, as well as financial, technical, managerial, permitting, and compliance issues:
The Division of Water Resources (DWR) provides the data contained within this
Local Water Supply Plan (LWSP) as a courtesy and service to our customers.
DWR staff does not field verify data. Neither DWR, nor any other party
involved in the preparation of this LWSP attests that the data is completely
free of errors and omissions. Furthermore, data users are cautioned that
LWSPs labeled PROVISIONAL have yet to be reviewed by DWR staff. Subsequent
review may result in significant revision. Questions regarding the accuracy
or limitations of usage of this data should be directed to the water system
and/or DWR.
|