|
The Division of Water Resources (DWR) provides the data contained within this
Local Water Supply Plan (LWSP) as a courtesy and service to our customers.
DWR staff does not field verify data. Neither DWR, nor any other party
involved in the preparation of this LWSP attests that the data is completely
free of errors and omissions. Furthermore, data users are cautioned that
LWSPs labeled PROVISIONAL have yet to be reviewed by DWR staff. Subsequent
review may result in significant revision. Questions regarding the accuracy
or limitations of usage of this data should be directed to the water system
and/or DWR.
1. System Information
Contact Information
Complete
| Water System Name: |
Burgaw |
|
PWSID: |
04-71-010 |
| Mailing Address: | 109 North Walker Street
Burgaw, NC 28425 | Ownership: | Municipality |
| |
| Contact Person: | Robert Alan Moore | Title: | Director of Public Works |
| Phone: | 910-259-9035 | Cell/Mobile: | -- |
| |
| Secondary Contact: | Mike Houston | | Phone: | 919-812-6088 |
| Mailing Address: |
, NC | Cell/Mobile: | -- |
Distribution System
| Line Type |
Size Range (Inches) |
Estimated % of lines |
| Asbestos Cement |
8 |
2.00 % |
| Cast Iron |
6-8 |
28.00 % |
| Ductile Iron |
6 |
1.00 % |
| Galvanized Iron |
1-2 |
13.00 % |
| Polyvinyl Chloride |
1-12 |
56.00 % |
Programs
As employees ride throughout the system they are looking for leaks. AMI meters are also utilized to help pinpoint leaks as well. We also utilize NCRWA as needed. Water Conservation
Burgaw is waiting to see how the Gen-X issue is going to affect Pender County Water supply before finishing the water interconnection project. 2. Water Use Information
Service Area
| Sub-Basin(s) | % of Service Population |
|---|
| Northeast Cape Fear River (02-5) | 100 % |
|
| County(s) | % of Service Population |
|---|
| Pender | 100 % |
|
Water Use by Type
| Type of Use |
Metered
Connections |
Metered
Average Use (MGD) |
Non-Metered
Connections |
Non-Metered
Estimated Use (MGD) |
| Residential |
1,216 |
0.1062 |
0 |
0.0000 |
| Commercial |
310 |
0.0585 |
0 |
0.0000 |
| Industrial |
5 |
0.0399 |
0 |
0.0000 |
| Institutional |
17 |
0.0802 |
0 |
0.0000 |
How much water was used for system processes (backwash, line cleaning, flushing, etc.)? 0.0200 MGD
3. Water Supply Sources
Monthly Withdrawals & Purchases
|
Average Daily
Use (MGD) |
Max Day
Use (MGD) |
|
Average Daily
Use (MGD) |
Max Day
Use (MGD) |
|
Average Daily
Use (MGD) |
Max Day
Use (MGD) |
| Jan |
0.4335 |
|
May |
0.4306 |
|
Sep |
0.4348 |
|
| Feb |
0.3994 |
|
Jun |
0.4180 |
|
Oct |
0.3998 |
|
| Mar |
0.3921 |
|
Jul |
0.4289 |
|
Nov |
0.3608 |
|
| Apr |
0.4186 |
|
Aug |
0.3990 |
|
Dec |
0.3745 |
|

Ground Water Sources
| Name or Number |
Average Daily Withdrawal (MGD) |
Max Day Withdrawal (MGD) |
12-Hour Supply
(MGD) |
CUA Reduction |
Year Offline |
Use Type |
| MGD |
Days Used |
| Ashe St. |
0.1230 |
329 |
|
0.3080 |
|
|
Regular |
| N. Smith St. |
0.1549 |
339 |
|
0.3520 |
|
|
Regular |
| S. Smith St. |
0.1014 |
331 |
|
0.1520 |
|
|
Regular |
| Wright St. |
0.0678 |
328 |
|
0.1120 |
|
|
Regular |
Ground Water Sources (continued)
| Name or Number |
Well Depth (Feet) |
Casing Depth
(Feet) |
Screen Depth (Feet) |
Well Diameter (Inches) |
Pump Intake Depth (Feet) |
Metered? |
| Top |
Bottom |
| Ashe St. |
330 |
330 |
105 |
310 |
8 |
225 |
Yes |
| N. Smith St. |
320 |
320 |
194 |
310 |
10 |
170 |
Yes |
| S. Smith St. |
512 |
205 |
205 |
446 |
6 |
185 |
Yes |
| Wright St. |
295 |
295 |
200 |
295 |
8 |
200 |
Yes |
4. Wastewater Information
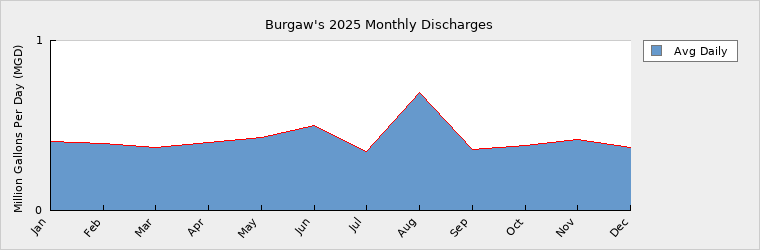
Monthly Discharges
|
Average Daily
Discharge (MGD) |
|
Average Daily
Discharge (MGD) |
|
Average Daily
Discharge (MGD) |
| Jan |
0.4079 |
May |
0.4270 |
Sep |
0.3601 |
| Feb |
0.3954 |
Jun |
0.4997 |
Oct |
0.3827 |
| Mar |
0.3682 |
Jul |
0.3488 |
Nov |
0.4161 |
| Apr |
0.4010 |
Aug |
0.6949 |
Dec |
0.3718 |
Wastewater Interconnections
| Water System |
PWSID |
Type |
Average Daily Amount |
Contract
Maximum (MGD) |
| MGD |
Days Used |
| Town of Wallace Regional WWTP |
04-31-010 |
Discharging |
0.4231 |
365 |
1.6500 |
5. Planning
Projections
| |
2025 |
2030 |
2040 |
2050 |
2060 |
2070 |
| Year-Round Population |
4,250 |
4,647 |
5,393 |
6,167 |
7,051 |
8,062 |
| Seasonal Population |
0 |
0 |
0 |
0 |
0 |
0 |
| |
| Residential |
0.1062 |
0.1161 |
0.1347 |
0.1540 |
0.1760 |
0.2012 |
| Commercial |
0.0585 |
0.0639 |
0.0742 |
0.0848 |
0.0969 |
0.1108 |
| Industrial |
0.0399 |
0.0399 |
0.0399 |
0.0399 |
0.0399 |
0.0399 |
| Institutional |
0.0802 |
0.0877 |
0.1017 |
0.1630 |
0.1329 |
0.1519 |
| System Process |
0.0200 |
0.0218 |
0.0252 |
0.0288 |
0.0329 |
0.0376 |
| Unaccounted-for |
0.1028 |
0.1111 |
0.1267 |
0.1587 |
0.1614 |
0.1826 |
Future Supply Sources
| Source Name |
PWSID |
Source Type |
Additional Supply |
Year Online |
Year Offline |
Type |
| Pender County Utilities |
70-71-011 |
Purchase |
0.1000 |
2023 |
2029 |
Regular |
| Pender County Utilities |
70-71-011 |
Purchase |
0.7000 |
2040 |
|
Regular |
Future supplies are based on conditions of the Pender County IBT certificate. Demand v/s Percent of Supply
| |
2025 |
2030 |
2040 |
2050 |
2060 |
2070 |
| Surface Water Supply |
0.0000 |
0.0000 |
0.0000 |
0.0000 |
0.0000 |
0.0000 |
| Ground Water Supply |
0.9240 |
0.9240 |
0.9240 |
0.9240 |
0.9240 |
0.9240 |
| Purchases |
0.0000 |
0.0000 |
0.0000 |
0.0000 |
0.0000 |
0.0000 |
| Future Supplies |
0.0000 |
0.7000 |
0.7000 |
0.7000 |
0.7000 |
| Total Available Supply (MGD) |
0.9240 |
0.9240 |
1.6240 |
1.6240 |
1.6240 |
1.6240 |
| Service Area Demand |
0.4076 |
0.4405 |
0.5024 |
0.6292 |
0.6400 |
0.7240 |
| Sales |
0.0000 |
0.0000 |
0.0000 |
0.0000 |
0.0000 |
0.0000 |
| Future Sales |
0.0000 |
0.0000 |
0.0000 |
0.0000 |
0.0000 |
| Total Demand (MGD) |
0.4076 |
0.4405 |
0.5024 |
0.6292 |
0.6400 |
0.7240 |
| Demand as Percent of Supply |
44% |
48% |
31% |
39% |
39% |
45% |

The purpose of the above chart is to show a general indication of how the long-term per capita water demand changes over time. The per capita water demand may actually be different than indicated due to seasonal populations and the accuracy of data submitted. Water systems that have calculated long-term per capita water demand based on a methodology that produces different results may submit their information in the notes field.
Your long-term water demand is 25 gallons per capita per day. What demand management practices do you plan to implement to reduce the per capita water demand (i.e. conduct regular water audits, implement a plumbing retrofit program, employ practices such as rainwater harvesting or reclaimed water)? If these practices are covered elsewhere in your plan, indicate where the practices are discussed here.
No Changes
Are there other demand management practices you will implement to reduce your future supply needs? No Changes
What supplies other than the ones listed in future supplies are being considered to meet your future supply needs? The Town has developed a CIP that outlines the possibility of constructing wells and elevated storage tanks during tears of... 2025-2026 & 2028-2029 & 2031-2032.
How does the water system intend to implement the demand management and supply planning components above? Town is looking to seek grants and (or) loans.
Utilize funds from Town Water & Sewer Enterprise fund budget.
Work closely with future developer(s) on project cost sharing opportunities.
Additional Information
Has this system participated in regional water supply or water use planning? Yes, CCPCUA
What major water supply reports or studies were used for planning? CCPCUA
Please describe any other needs or issues regarding your water supply sources, any water system deficiencies or needed improvements (storage, treatment, etc.) or your ability to meet present and future water needs. Include both quantity and quality considerations, as well as financial, technical, managerial, permitting, and compliance issues: N/A
The Division of Water Resources (DWR) provides the data contained within this
Local Water Supply Plan (LWSP) as a courtesy and service to our customers.
DWR staff does not field verify data. Neither DWR, nor any other party
involved in the preparation of this LWSP attests that the data is completely
free of errors and omissions. Furthermore, data users are cautioned that
LWSPs labeled PROVISIONAL have yet to be reviewed by DWR staff. Subsequent
review may result in significant revision. Questions regarding the accuracy
or limitations of usage of this data should be directed to the water system
and/or DWR.
|